
Continuous glucose monitors and other wearables promise real-time insight into your metabolism. Here’s what the numbers actually mean for people without diabetes, where the devices fall short, and how to use the data without creating unnecessary anxiety.
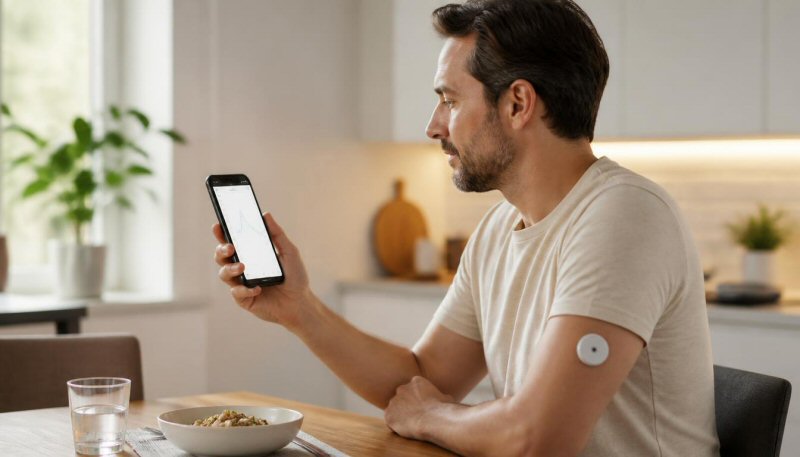
You glance at your phone and see a sudden upward curve. Your continuous glucose monitor just registered a spike after lunch. Instantly the questions start: Is this normal? Should I have skipped the rice? Am I heading toward metabolic trouble? For millions of people without diabetes who now wear these devices, the data feels both empowering and unsettling.
Continuous glucose monitors (CGMs) and related metabolic wearables have moved from specialty diabetes care into the mainstream wellness market. Over-the-counter versions are widely available, and subscription services package the sensors with coaching apps that score every meal. The promise is clear: real-time visibility into how food, stress, sleep, and movement affect your blood sugar. The reality is more nuanced.
This article examines what CGM data can reliably show, where the technology has meaningful limitations (especially for people without diabetes), and how to interpret the numbers without creating unnecessary anxiety or restrictive habits.
How Continuous Glucose Monitors Actually Work
Unlike a traditional finger-stick blood glucose meter, a CGM does not measure glucose in the blood. A tiny sensor filament sits just under the skin and measures glucose in the interstitial fluid—the fluid that surrounds your cells. Readings are typically recorded every one to five minutes and transmitted to a smartphone or reader.
Because interstitial glucose lags behind blood glucose, there is usually a delay of several minutes, especially when levels are rising or falling quickly. Most modern factory-calibrated sensors report a Mean Absolute Relative Difference (MARD) in the 8–12% range under controlled conditions. That means a true glucose value of 100 mg/dL could reasonably display as 88–112 mg/dL or wider, depending on the device, the rate of change, and individual factors.
Accuracy is generally strongest in the euglycemic and hyperglycemic ranges and weaker when glucose is low or changing rapidly. Compression on the sensor (for example, sleeping on the arm), dehydration, certain medications, and even the specific brand or lot of sensor can introduce further variation. Studies have shown that two sensors worn simultaneously on the same person can produce noticeably different readings.
What “Normal” Looks Like on a CGM
For people without diabetes, glucose is not supposed to stay perfectly flat. Healthy physiology includes rises after meals, modest overnight dips, and temporary elevations with intense exercise or stress.
Research characterizing CGM patterns in non-diabetic adults shows that most readings typically fall between roughly 70 and 140 mg/dL, with a substantial portion of the day spent between 80 and 110–120 mg/dL. Post-meal peaks commonly reach 140 mg/dL or higher and then decline. One large analysis found that even normoglycemic individuals spent, on average, about three hours per day above 140 mg/dL. Readings above 180 mg/dL occur but are less frequent in metabolically healthy people.
Mean 24-hour glucose in healthy cohorts often centers around 95–105 mg/dL. Variability (how much the number swings around the average) is also a normal feature. A completely flat line is neither realistic nor necessary for good metabolic health.
Importantly, the time-in-range targets developed for people with diabetes (commonly 70–180 mg/dL for a high percentage of the day) were never designed as optimal targets for people without diabetes. Applying diabetic thresholds to healthy individuals can create the false impression that ordinary post-meal rises are pathological.
What the Data Can Usefully Tell You
When interpreted carefully, CGM data offers several practical insights:
- Personal food responses. The same carbohydrate source can produce very different curves in different people, or even in the same person on different days depending on sleep, stress, prior activity, and meal composition. Pairing carbohydrates with protein, fat, and fiber often blunts the rise. A short walk after eating frequently reduces the peak.
- Behavioral feedback. Seeing a clear rise after a particular meal or snack can motivate useful changes—adding vegetables first, reducing liquid sugars, or adjusting portion size—without requiring long-term daily monitoring.
- Effects of lifestyle factors. Poor sleep, high stress, and prolonged sitting can elevate glucose or increase variability. High-intensity exercise may cause temporary rises (a normal physiological response), while steady aerobic activity often stabilizes levels.
- Early pattern recognition. In some individuals, CGM may reveal exaggerated or prolonged post-meal excursions or elevated overnight baselines that prompt discussion with a clinician and formal laboratory testing (fasting glucose, HbA1c, or oral glucose tolerance test).
Short-term use (a few weeks) is often sufficient for most healthy people to identify their strongest personal triggers and then apply those lessons without continuous sensor wear.
What the Data Does Not Tell You
Several important limitations are frequently overlooked in consumer marketing:
- It is not a diagnostic test. Diagnosis of prediabetes or diabetes still rests on standardized laboratory measures (venous plasma glucose or NGSP-certified HbA1c), not sensor readings. A single high CGM value or even a pattern of elevated readings does not equal a diagnosis.
- Correlation with long-term control is weak in healthy people. A large Mass General Brigham analysis of nearly 1,000 adults found that CGM metrics correlated strongly with HbA1c in people with type 2 diabetes, more weakly in those with prediabetes, and essentially not at all in those with normal glucose regulation. Short-term fluctuations visible on a CGM simply do not move the three-month average enough to track with HbA1c when baseline control is already good.
- Accuracy has real limits. Independent evaluations have shown that some sensors can systematically overestimate glucose after certain foods (for example, fruit) relative to blood measurements. Lag time and sensor-to-sensor differences further complicate precise absolute numbers.
- No consensus on interpretation for non-diabetics. When researchers presented the same CGM reports from people without diabetes to a panel of experienced clinicians, agreement on whether follow-up was warranted was poor. Experts disagreed about which patterns were concerning versus normal physiology.
- It does not measure insulin, insulin resistance, or overall metabolic health directly. Glucose is only one piece of a larger picture that includes insulin dynamics, lipids, inflammation, body composition, and more.
In short, CGM data is excellent at showing short-term behavioral responses and trends. It is far less reliable as a standalone indicator of long-term risk or as a tool for fine-tuning every meal in someone who already has normal laboratory values.
Common Sources of Misleading Readings
Several everyday situations can produce numbers that look alarming but have non-pathological explanations:
- Post-meal rises. A healthy response to carbohydrates is a temporary increase followed by a return toward baseline. The absolute height and duration matter more than the mere presence of a curve.
- Exercise-related spikes. Anaerobic or high-intensity efforts can raise glucose as the liver releases stored energy. This is expected physiology, not a problem.
- Compression lows. Lying on the sensor can artificially suppress the reading. Many overnight “lows” resolve when the person changes position.
- Dawn phenomenon and overnight variability. Hormonal changes in the early morning hours can produce modest rises even without food.
- Sensor warmup and insertion effects. The first 12–24 hours after insertion are often less reliable.
- Stress and sleep disruption. Cortisol and reduced sleep quality can elevate glucose independently of food.
Obsessing over every small fluctuation or aiming for an artificially flat line can lead to unnecessary food restriction, anxiety, or the avoidance of nutritious foods (such as fruit) simply because they produce a visible rise.
Myths vs Facts
Myth: Any spike above 140 mg/dL is harmful and should be avoided at all costs.
Fact: Healthy people regularly exceed 140 mg/dL after meals. The pattern, frequency, duration, and overall average matter more than isolated peaks.
Myth: CGM data is as accurate as a laboratory blood test.
Fact: Sensors measure interstitial fluid with a known lag and an error margin. They are excellent for trends but not interchangeable with venous plasma values.
Myth: Flattening your glucose curve as much as possible is the primary goal of metabolic health.
Fact: Some variability is normal and expected. Extreme restriction to eliminate all rises can create other nutritional or psychological downsides.
Myth: If your CGM looks “good,” you do not need laboratory testing.
Fact: CGM and HbA1c/fasting glucose provide complementary but different information. Formal labs remain essential for diagnosis and long-term risk assessment.
Myth: Everyone without diabetes would benefit from continuous long-term CGM use.
Fact: Evidence for sustained health outcome benefits in people with normal glucose regulation is still limited. Short educational periods of wear are often more practical than indefinite monitoring.
How to Use CGM Data Wisely
If you choose to try a continuous glucose monitor, a structured approach reduces the risk of data overload:
- Wear it for a defined period (typically 2–4 weeks) rather than indefinitely at first.
- Log meals, sleep, stress, and activity alongside the glucose data so patterns become interpretable.
- Focus on relative responses rather than absolute numbers. Compare similar meals under different conditions (with or without a walk, higher versus lower protein, etc.).
- Look at overall daily patterns and multi-day averages more than single peaks.
- Use the insights to experiment with practical changes—meal order, post-meal movement, sleep consistency—then reassess.
- Once you understand your main personal triggers, many people can stop continuous wear and apply the lessons with periodic check-ins if desired.
Pairing the sensor data with established lifestyle foundations (adequate protein and fiber, resistance training, consistent sleep, stress management, and avoiding ultra-processed sugars) produces more reliable benefits than chasing perfect sensor scores alone.
When the Numbers Suggest You Should See a Doctor
CGM data alone should not diagnose disease, but certain patterns reasonably prompt formal evaluation:
- Repeated fasting or overnight readings consistently well above the typical healthy range
- Frequent or prolonged excursions above 180–200 mg/dL after ordinary meals
- Symptoms that accompany the glucose changes (excessive thirst, unexplained fatigue, frequent urination, blurry vision, or unintentional weight changes)
- A family history of diabetes combined with concerning patterns
- Any reading that raises personal concern—bring the data and discuss it with a clinician who can order appropriate laboratory confirmation
Standard laboratory testing remains the appropriate next step. An oral glucose tolerance test or repeated fasting glucose and HbA1c measurements provide clearer diagnostic information than sensor trends alone.
Natural Ways to Support More Stable Glucose Patterns
Regardless of whether you wear a CGM, several evidence-aligned habits support smoother glucose responses:
- Build meals around protein, non-starchy vegetables, and healthy fats; place higher-carbohydrate foods later in the meal.
- Take a 10–20 minute walk after larger meals.
- Prioritize consistent, adequate sleep.
- Include regular resistance training and some form of daily movement.
- Manage chronic stress through whatever methods work for you (breathing practices, time outdoors, social connection, or structured recovery).
- Limit sugar-sweetened beverages and ultra-processed snacks that produce rapid, large rises.
- Stay well hydrated and maintain a healthy body composition over time.
These foundations improve insulin sensitivity and overall metabolic resilience far more reliably than micromanaging every sensor reading.
Frequently Asked Questions
Do I need a continuous glucose monitor if I don’t have diabetes?
Not necessarily. For most metabolically healthy people, short-term educational use can be interesting and informative, but continuous long-term wear is not required and lacks strong outcome evidence in this population. Focus first on the basics of diet, movement, sleep, and body composition.
Why do my readings sometimes look different from a finger-stick test?
CGMs measure interstitial fluid, not capillary or venous blood, and there is a physiological lag. Accuracy also varies with the rate of change, sensor placement, and device-specific characteristics. Trends are more trustworthy than any single paired comparison.
Is it normal for glucose to rise after exercise?
Yes, especially with higher-intensity or anaerobic efforts. The liver releases glucose to fuel working muscles. This temporary rise is expected physiology and generally not a cause for concern in healthy individuals.
Can CGM data replace my annual blood work?
No. HbA1c, fasting glucose, lipid panels, and other laboratory markers provide complementary information that sensors cannot replace. Use CGM insights to inform lifestyle choices and discuss any concerning patterns with your clinician.
Why do experts disagree about what is “normal” on a CGM for non-diabetics?
Reference ranges and clinical decision thresholds for continuous monitoring in people without diabetes are still being developed. Large observational datasets are helping define typical patterns, but consensus guidelines for action remain limited compared with the clear targets used in diabetes care.
Should I aim for a completely flat glucose line?
No. Some post-meal rise and day-to-day variability are normal. Excessive focus on eliminating every curve can lead to overly restrictive eating or unnecessary anxiety. Stability within a reasonable range, good recovery after meals, and healthy overall averages are more realistic and beneficial goals.
How long should I wear a CGM if I’m just curious?
Many people gain most of the useful personal insights within two to four weeks of attentive use paired with food and activity logging. After that period, the marginal benefit of continuous data often diminishes for those without diabetes or prediabetes.
Conclusion
Continuous glucose monitors are powerful tools when used with clear eyes. For people living with diabetes, the real-time data has transformed daily management and improved outcomes. For people without diabetes, the same devices can reveal personal responses to food, movement, and lifestyle in a way that was previously invisible. That insight can be genuinely useful.
At the same time, the numbers are not perfect, the interpretation frameworks for healthy individuals are still maturing, and the data does not replace laboratory diagnosis or foundational health habits. Treating every rise as a problem, or every flat stretch as a victory, risks turning a helpful feedback tool into a source of stress.
The most balanced approach is to use the technology intentionally—often for a limited educational window—extract the practical lessons that improve your daily choices, and then return attention to the bigger picture of sustainable nutrition, strength, recovery, and overall metabolic resilience. The data can inform you. It does not have to define you.